



By: Nghiinomenwa-vali Hangala
According to the 2025 Namibia Financial Inclusion Survey, most farming households (87.1%) are farming to produce food for self consumption, not for income generation.
The survey found that only a small proportion (9.6%) of households’ farm for both consumption and selling, while only 3.3% reported farming primarily for commercial (selling) purposes.
Namibia has 755,292 households, with less than half (45.5%) involved in farming (crops and livestock).
According to the report, the low participation in commercial agriculture shows that “farming in Namibia remains largely subsistence-oriented, with limited participation in market-driven production.”
The survey collected information on farming, which is generally considered as a driver of financial inclusion, not only as a source of labour, but also as a business for selling agricultural products.
Of the 339,882 households that reported being involved in agriculture, about 27.4% indicated that they combined farming with other forms of work.
Only 17.2% rely solely on farming, highlighting the relatively small proportion of households fully dependent on agriculture.
Non-commercial farmers, who farm mainly for consumption, were asked if they had considered transforming their farming activities into a business.
The results show that most non-commercial farmers (73.1%) have never considered transforming their farming activities into a business.
Meanwhile, 17.8% have considered becoming commercial farmers.
According to the Survey results, the main reason for not considering farming as a business is that it is viewed as a family activity (39.3%).
This is followed by a lack of sufficient land (36.5%), inadequate funds to support commercial farming (17.6%), and having alternative sources of income (15.9%).
Overall, the findings point to both resource constraints and attitudinal factors as key barriers to commercialisation.
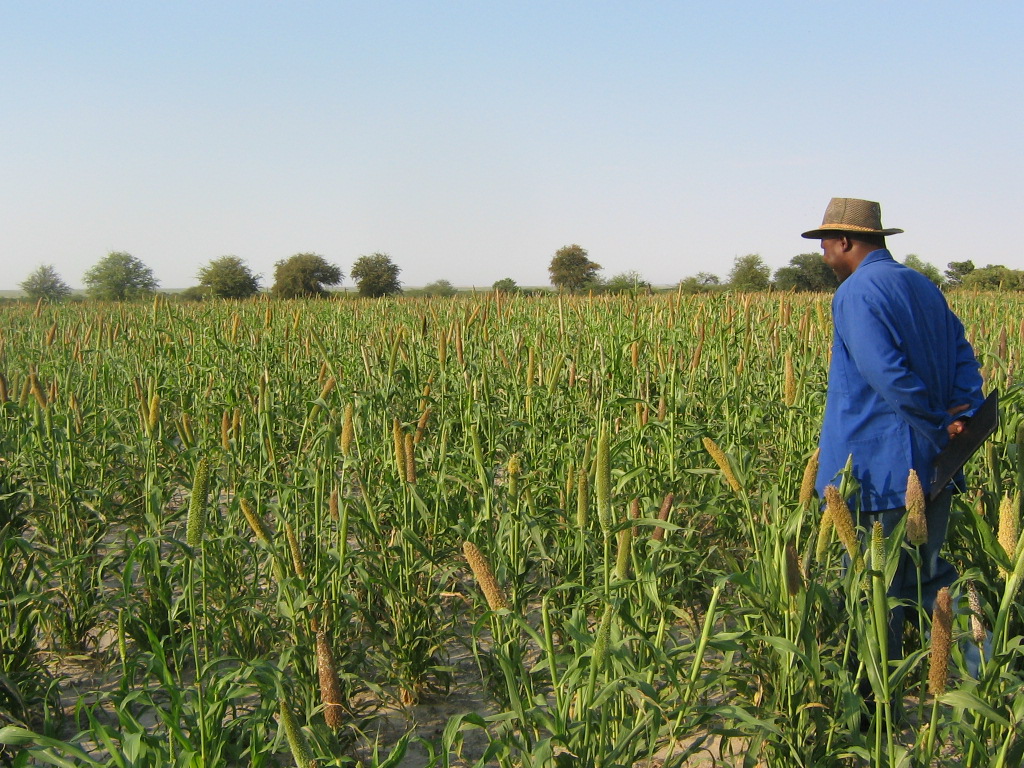
For those involved in crop farming, mahangu remains the dominant crop, reported by 77.2% of farming households, consistent with the 76.7% reported in 2017.
This is followed by maize (53.8%), while vegetables (36.3%) are grown by smaller proportions of households.
Fruit (8.8%) and wheat (4.0%) are the least commonly cultivated crops.
Some of the households also continue to collect indigenous natural products. Marula is the most collected (22.9%), indicating a shift from 2017 when bird plum (Eembe) was dominant.
Bird plum now sits at 15.9%, closely followed by wild orange (maguni/mauni) at 15.3%.
Other products such as Jackal berry (10.4%) and mopane worms (9.1%) are collected by smaller proportions, while the remaining products are reported by relatively few households.
LIVESTOCK FARMING
The Survey has also zoomed in on households’ attitudes and perceptions towards livestock farming.
It found that 64.7% of the households do not view regular livestock sales as a primary means of generating income.
However, most households (82.9%) reported that they sell livestock when cash is needed.
Additionally, 72.0% regard livestock as a form of saving.
Overall, the results indicate that livestock is primarily perceived as a financial safety net rather than a consistent income-generating activity.
Looking at livestock farming activities among farming households, goats (64.5%) and poultry (64.2%) were the most kept livestock, both showing notable increases of 8.3 percentage points and 12.0 percentage points, respectively, since 2017.
Cattle farming is less prevalent, with 35.8% of households keeping cattle for beef production and 25.6% for dairy.
Other livestock such as donkeys (18.5%), pigs (18.3%) and sheep (16.2%) are kept by smaller proportions, while horses and other activities remain minimal.
Nearly half of farming households (47.8%) reported that they do not use or need to purchase inputs for farming; instead, they manage with what they already have.
Among those who finance inputs, 24.4% use their savings, while 19.7% rely on income from selling livestock.
A smaller proportion depends on non-farming income sources (11.5%) or crop sales (5.7%), with very limited use of borrowing or formal credit, showing the extent to which farming households receive inputs from the government at a lower cost.
Most households (70.7%) reported not receiving any government support inputs. Only 17.8% reported access to subsidised inputs.
The majority of those who received farming inputs from the government (72.6%) received seeds, followed by 23.3% who accessed ploughing tractors, and 17% who accessed vaccines.